2.3 KiB
Visualizing MediaPipe Graphs
To help users understand the structure of their calculator graphs and to understand the overall behavior of their machine learning inference pipelines, we have built the MediaPipe Visualizer that is available online.
-
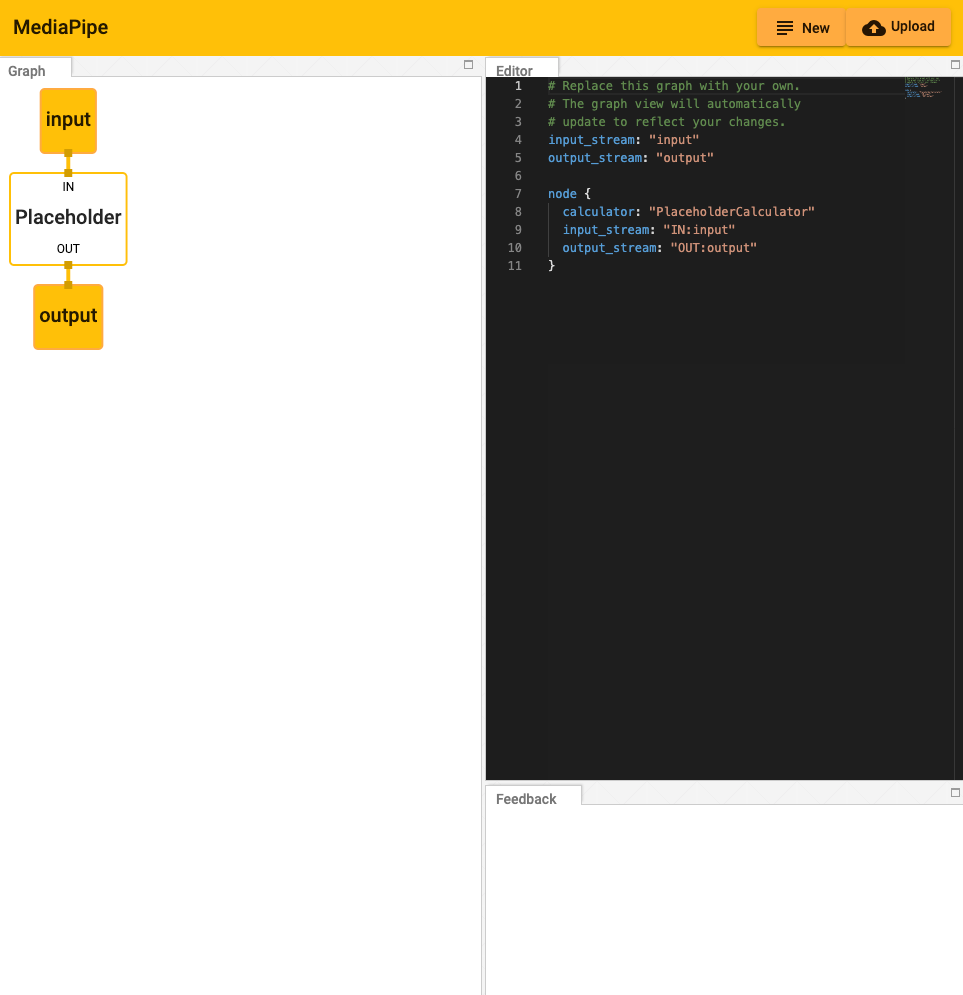
A graph view allows users to see a connected calculator graph as expressed through a graph configuration that is pasted into the graph editor or uploaded. The user can visualize and troubleshoot a graph they have created.
Working within the editor
Getting Started:
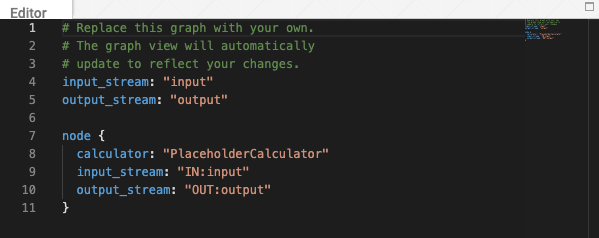
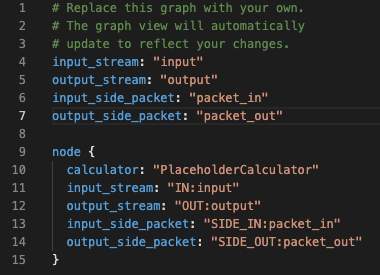
The graph can be modified by adding and editing code in the Editor view.
-
Pressing the "New" button in the upper right corner will clear any existing code in the Editor window.
-
Pressing the "Upload" button will prompt the user to select a local PBTXT file, which will everwrite the current code within the editor.
-
Alternatively, code can be pasted directly into the editor window.
-
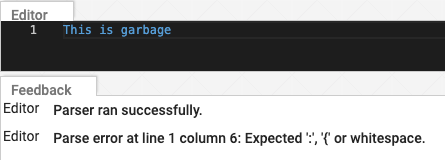
Errors and informational messages will appear in the Feedback window.
Understanding the Graph
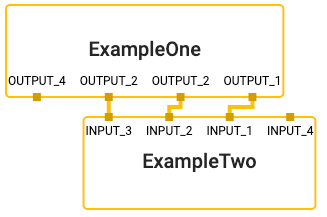
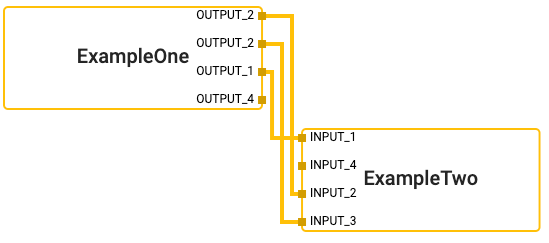
The visualizer graph shows the connections between calculator nodes.
-
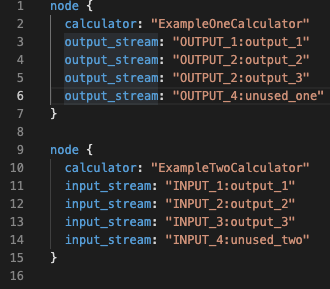
Streams exit from the bottom of the calculator producing the stream and enter the top of any calculator receiving the stream. (Notice the use of the key, "input_stream" and "output_stream").
-
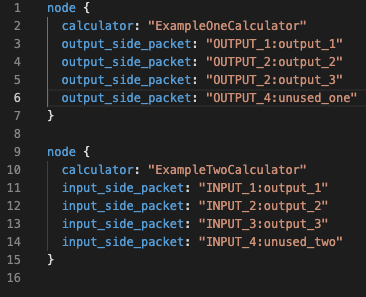
Sidepackets work the same, except that they exit a node on the right and enter on the left. (Notice the use of the key, "input_side_packet" and "output_side_packet").
-
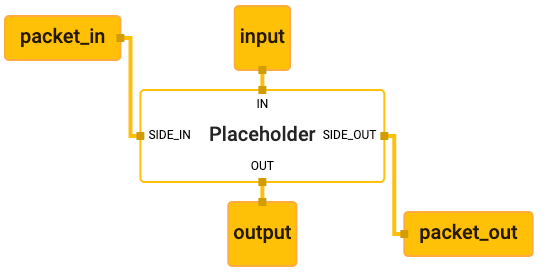
There are special nodes that represent inputs and outputs to the graph and can supply either side packets or streams.
