12 KiB
| layout | target | title | parent | nav_order |
|---|---|---|---|---|
| forward | https://developers.google.com/mediapipe/ | Tracing and Profiling | Tools | 2 |
Tracing and Profiling
{: .no_toc }
- TOC {:toc}
Attention: Thanks for your interest in MediaPipe! We have moved to https://developers.google.com/mediapipe as the primary developer documentation site for MediaPipe as of April 3, 2023.
The MediaPipe framework includes a built-in tracer and profiler. The tracer records various timing events related to packet processing, including the start and end time of each Calculator::Process call. The tracer writes trace log files in binary protobuf format. The profiler further accumulates for each running calculator a histogram of latencies for Process calls. Tracing and profiling is available on Linux, Android, or iOS.
Enabling tracing and profiling
To enable tracing and profiling of a mediapipe graph:
- The profiling library must be linked to the framework.
- Tracing and profiling must be enabled in the graph configuration.
The profiling library is linked to the framework by default for Desktop.
If needed, it can be omitted from the framework using the bazel command line
option: --define MEDIAPIPE_PROFILING=0. For other platforms, you can use the
bazel command line option --define MEDIAPIPE_PROFILING=1 to link it.
To enable tracing and profiling, the CalculatorGraphConfig (in
calculator.proto)
representing the graph must have a profiler_config message at its root. Here
is a simple setup that turns on tracing and keeps 100 seconds of timing events:
profiler_config {
  trace_enabled: true
  enable_profiler: true
  trace_log_interval_count: 200
  trace_log_path: "/sdcard/Download/"
}
-
enable_profileris required to emit any logging at all. -
trace_enabledgives us packet level information needed for offline profiling. -
trace_log_countis a convenience that allows us to, by default, to chop up our log into five separate files which are filled up in a round robin fashion (after the fifth file is recorded, the first file is used again). The trace log files are namedtrace_0.logthroughtrace_k.log.See Profiler configuration for other settings available in the profiler config. Note that most of the other settings are considered advanced, and in general should not be needed.
Collecting the Logs
MediaPipe will emit data into a pre-specified directory:
-
On the desktop, this will be the
/tmpdirectory. -
On Android, this will be the external storage directory (e.g.,
/storage/emulated/0/). -
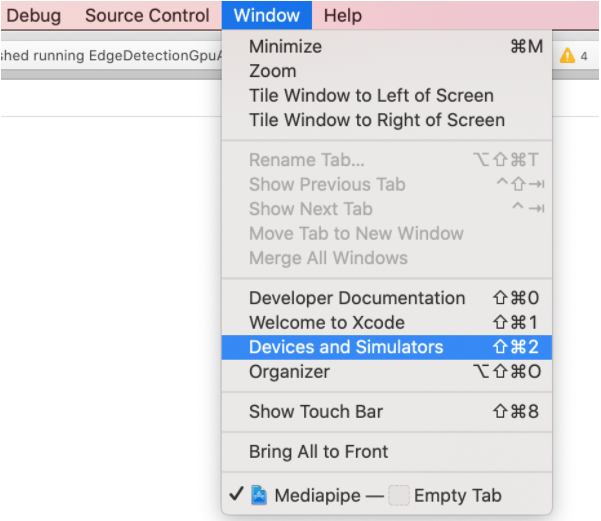
On iOS, this can be reached through XCode. Select "Window/Devices and Simulators" and select the "Devices" tab.
You can open the Download Container. Logs will be located in
application container/.xcappdata/AppData/Documents/If XCode shows empty content for the downloaded container file, you can right click and select 'Show Package Contents' in Finder. Logs will be located in 'AppData/Documents/'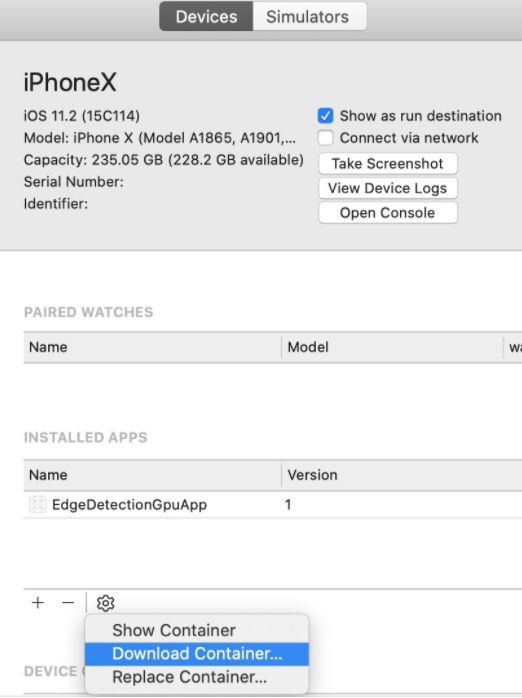
Log files are written to \<trace_log_path index\>.binarypb where, by default,
\<trace_log_path\> is equal to mediapipe_trace_ (the entire path and file
prefix can be overwritten by setting trace_log_path within the
profiler_config message). The index will, by default, alternate between 0 and
1, unless you've overridden the trace_log_count as we did, above.
By default, each file records five seconds of events. (Advanced: Specifically,
we record ten intervals of half a second each. This can be overridden by adding
trace_log_interval_usec and trace_log_interval_count to profiler_config).
Tracing on Linux
-
Follow the instructions stated above in
Enable tracing -
Build and run your MediaPipe graph. The running graph writes trace events as stated above in
Collect the logs
Tracing on Android
-
Ensure that the Android app has write permissions to external storage.
-
Include the line below in your
AndroidManifest.xmlfile.<uses-permission android:name="android.permission.MANAGE_EXTERNAL_STORAGE" /> -
Grant the permission either upon first app launch, or by going into
Settings -> Apps & notifications -> $YOUR_APP -> Permissionsand enableStorage.
-
-
Add the following protobuf message into the existing calculator-graph-config protobuf, such as the existing
.pbtxtfile. Follow the instructions stated above inEnable tracing -
Connect your Android device and run
adb devices.adb devices # should print: # List of devices attached # 805KPWQ1876505 device -
Use
bazel buildto compile the Android app and useadb installto get it installed on your Android device. -
Open the installed Android app. The running MediaPipe graph appends trace events to a trace log files at:
/storage/emulated/0/Download/mediapipe_trace_0.binarypb
/storage/emulated/0/Download/mediapipe_trace_1.binarypb
After every 5 sec, writing shifts to a successive trace log file, such that the most recent 5 sec of events are preserved. You can check whether the trace files have been written to the device using adb shell.
adb shell "ls -la /storage/emulated/0/Download"On android, MediaPipe selects the external storage (e.g.,
/storage/emulated/0/) for trace logs. This directory can be overridden using the settingtrace_log_path, like:profiler_config { trace_enabled: true enable_profiler: true trace_log_path: "/sdcard/Download/profiles/" }Note: The forward slash at the end of the
trace_log_pathis necessary for indicating thatprofilesis a directory (that should exist). -
Download the trace files from the device.
# from your terminal
adb pull /storage/emulated/0/Download/mediapipe_trace_0.binarypb
# if successful you should see something like
# /sdcard/mediapipe_trace_0.binarypb: 1 file pulled. 0.1 MB/s (6766 bytes in 0.045s)
Analyzing the Logs
Trace logs can be analyzed from within the visualizer.
-
Navigate to viz.mediapipe.dev
-
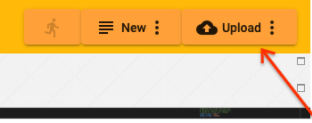
Click on the "Upload" button in the upper right.
-
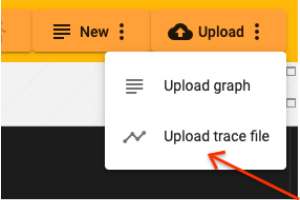
Click on "Upload trace file".
A sample trace file has been generated for you: sample_trace_binary.pb
-
A file selection popup will appear. Select the
.binarypbthat holds your trace information. -
A chart view will appear. All of your calculators will appear along the left with profiling information listed along the top.
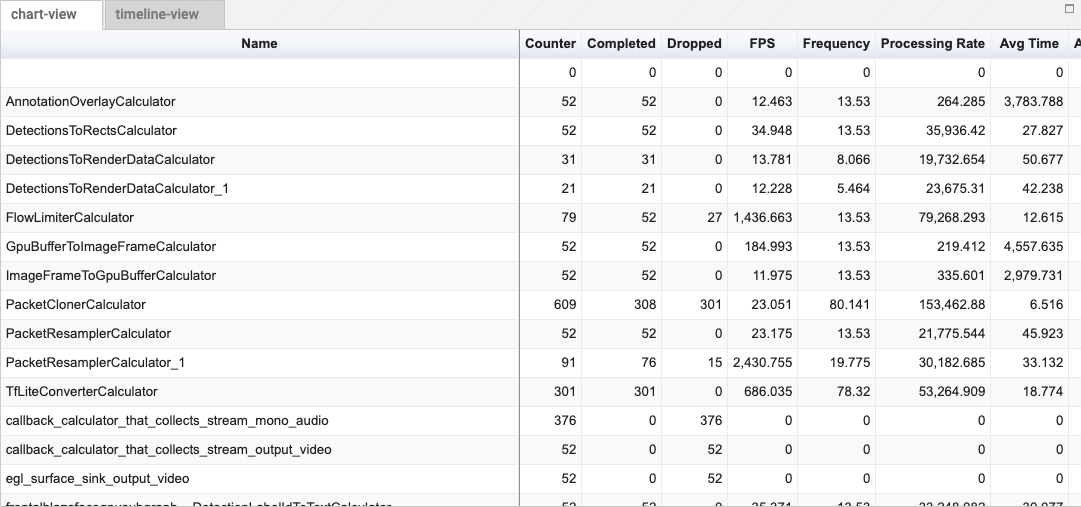
Click on a header to alternately sort that column in ascending or descending order. You can also scroll horizontally and vertically within the control to see more columns and more calculators.
Explanation of columns:
- name
- The name of the calculator.
- fps
- The number of frames that this calculator can generate each second, on
average.
1 / (input_latency_mean + time_mean) (Units are 1 / second). - frequency
- The rate that this calculator was asked to process packets per second.
(Computed by
# of calls total / (last_call_time - first_call_time)). (Units are1 / second) - counter
- Number of times process() was called on the calculator. It is the
sum of dropped + completed. - dropped
- Number of times the calculator was called but did not produce an output.
- completed
- Number of times that this calculator was asked to process inputs after which it generated outputs.
- processing_rate
1E+6 / time_mean. The number of times per second this calculator could run process, on average. (Units are1 / second).- thread_count
- The number of threads that made use of each calculator.
- time_mean
- Average time spent within a calculator (in microseconds).
- time_stddev
- Standard deviation of time_mean (in microseconds).
- time_total
- Total time spent within a calculator (in microseconds).
- time_percent
- Percent of total time spent within a calculator.
- input_latency_mean
- Average latency between earliest input packet used by a iteration of the calculator and when the calculator actually begins processing (in microseconds).
- input_latency_stddev
- Standard deviation of input_latency_mean (in microseconds).
- input_latency_total
- Total accumulated input_latency (in microseconds).
Profiler configuration
Many of the following settings are advanced and not recommended for general usage. Consult Enabling tracing and profiling for a friendlier introduction.
- histogram_interval_size_usec
- Specifies the size of the runtimes histogram intervals (in microseconds) to
generate the histogram of the
Process()time. The last interval extends to +inf. If not specified, the interval is 1000000 usec = 1 sec. - num_histogram_intervals
- Specifies the number of intervals to generate the histogram of the
Process()runtime. If not specified, one interval is used. - enable_profiler
- If true, the profiler starts profiling when graph is initialized.
- enable_stream_latency
- If true, the profiler also profiles the stream latency and input-output latency. No-op if enable_profiler is false.
- use_packet_timestamp_for_added_packet
- If true, the profiler uses packet timestamp (as production time and source
production time) for packets added by calling
CalculatorGraph::AddPacketToInputStream(). If false, uses the profiler's clock. - trace_log_capacity
- The maximum number of trace events buffered in memory. The default value buffers up to 20000 events.
- trace_event_types_disabled
- Trace event types that are not logged.
- trace_log_path
- The output directory and base-name prefix for trace log files. Log files are
written to:
StrCat(trace_log_path, index, ".binarypb") - trace_log_count
- The number of trace log files retained. The trace log files are named
"
trace_0.log" through "trace_k.log". The default value specifies 2 output files retained. - trace_log_interval_usec
- The interval in microseconds between trace log output. The default value specifies trace log output once every 0.5 sec.
- trace_log_margin_usec
- The interval in microseconds between TimeNow and the highest times included in trace log output. This margin allows time for events to be appended to the TraceBuffer.
- trace_log_instant_events
- False specifies an event for each calculator invocation. True specifies a separate event for each start and finish time.
- trace_log_interval_count
- The number of trace log intervals per file. The total log duration is:
trace_log_interval_usec * trace_log_count * trace_log_interval_count. The default value specifies 10 intervals per file. - trace_log_disabled
- An option to turn ON/OFF writing trace files to disk. Saving trace files to disk is enabled by default.
- trace_enabled
- If true, tracer timing events are recorded and reported.