2020-06-06 01:49:27 +02:00
|
|
|
---
|
2023-02-24 02:20:59 +01:00
|
|
|
layout: forward
|
|
|
|
|
target: https://developers.google.com/mediapipe/framework/tools/visualizer
|
2020-06-06 01:49:27 +02:00
|
|
|
title: Visualizer
|
|
|
|
|
parent: Tools
|
|
|
|
|
nav_order: 1
|
|
|
|
|
---
|
2019-06-17 01:03:25 +02:00
|
|
|
|
2020-06-06 01:49:27 +02:00
|
|
|
# Visualizer
|
|
|
|
|
{: .no_toc }
|
|
|
|
|
|
|
|
|
|
1. TOC
|
|
|
|
|
{:toc}
|
|
|
|
|
---
|
2019-06-17 01:03:25 +02:00
|
|
|
|
2023-04-04 00:12:06 +02:00
|
|
|
**Attention:** *Thanks for your interest in MediaPipe! We have moved to
|
|
|
|
|
[https://developers.google.com/mediapipe](https://developers.google.com/mediapipe)
|
|
|
|
|
as the primary developer documentation site for MediaPipe as of April 3, 2023.*
|
|
|
|
|
|
|
|
|
|
---
|
|
|
|
|
|
2019-06-17 01:03:25 +02:00
|
|
|
To help users understand the structure of their calculator graphs and to
|
|
|
|
|
understand the overall behavior of their machine learning inference pipelines,
|
2019-06-29 05:48:42 +02:00
|
|
|
we have built the [MediaPipe Visualizer](https://viz.mediapipe.dev/)
|
|
|
|
|
that is available online.
|
2019-06-17 01:03:25 +02:00
|
|
|
|
|
|
|
|
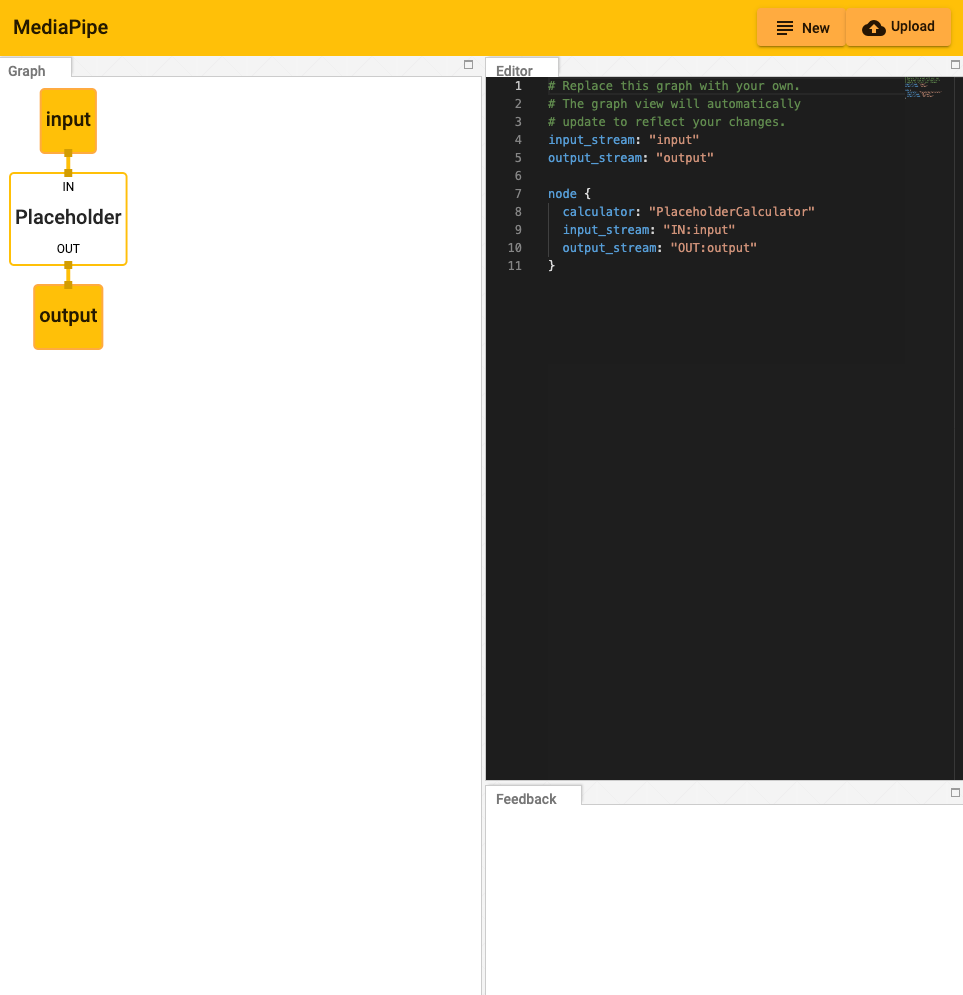
* A graph view allows users to see a connected calculator graph as expressed
|
|
|
|
|
through a graph configuration that is pasted into the graph editor or
|
|
|
|
|
uploaded. The user can visualize and troubleshoot a graph they have created.
|
|
|
|
|
|
2022-09-06 23:29:51 +02:00
|
|
|
|
2019-06-17 01:03:25 +02:00
|
|
|
|
2020-06-06 01:49:27 +02:00
|
|
|
## Working within the Editor
|
2019-06-17 01:03:25 +02:00
|
|
|
|
|
|
|
|
Getting Started:
|
|
|
|
|
|
|
|
|
|
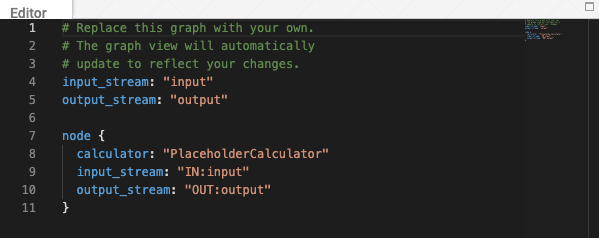
The graph can be modified by adding and editing code in the Editor view.
|
|
|
|
|
|
2022-09-06 23:29:51 +02:00
|
|
|
|
2019-06-17 01:03:25 +02:00
|
|
|
|
|
|
|
|
* Pressing the "New" button in the upper right corner will clear any existing
|
|
|
|
|
code in the Editor window.
|
|
|
|
|
|
2022-09-06 23:29:51 +02:00
|
|
|

|
2019-06-17 01:03:25 +02:00
|
|
|
|
|
|
|
|
* Pressing the "Upload" button will prompt the user to select a local PBTXT
|
2021-02-27 09:21:16 +01:00
|
|
|
file, which will overwrite the current code within the editor.
|
2019-06-17 01:03:25 +02:00
|
|
|
|
|
|
|
|
* Alternatively, code can be pasted directly into the editor window.
|
|
|
|
|
|
|
|
|
|
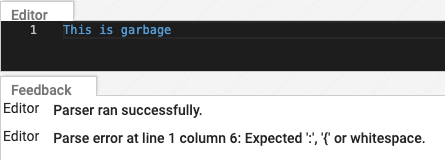
* Errors and informational messages will appear in the Feedback window.
|
|
|
|
|
|
2022-09-06 23:29:51 +02:00
|
|
|
|
2019-06-17 01:03:25 +02:00
|
|
|
|
2020-06-06 01:49:27 +02:00
|
|
|
## Understanding the Graph
|
2019-06-17 01:03:25 +02:00
|
|
|
|
|
|
|
|
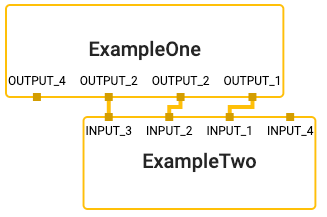
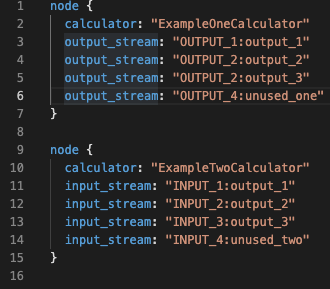
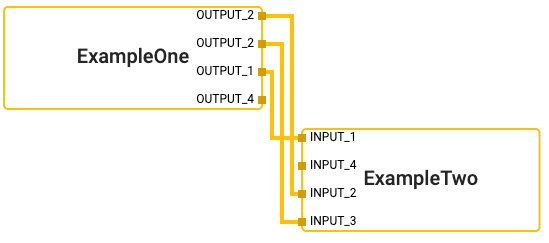
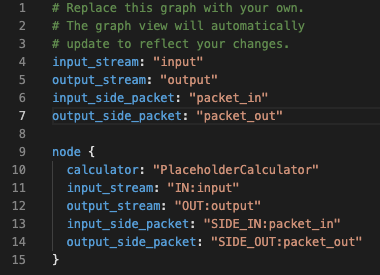
The visualizer graph shows the connections between calculator nodes.
|
|
|
|
|
|
|
|
|
|
* Streams exit from the bottom of the calculator producing the stream and
|
|
|
|
|
enter the top of any calculator receiving the stream. (Notice the use of the
|
|
|
|
|
key, "input_stream" and "output_stream").
|
|
|
|
|
|
2022-09-06 23:29:51 +02:00
|
|
|
|
2019-08-19 04:54:50 +02:00
|
|
|
|
2022-09-06 23:29:51 +02:00
|
|
|
|
2019-06-17 01:03:25 +02:00
|
|
|
|
|
|
|
|
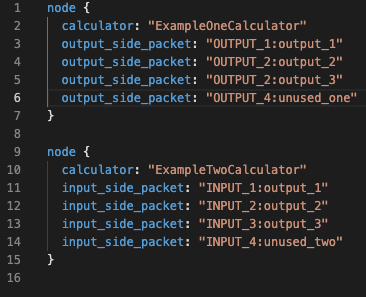
* Sidepackets work the same, except that they exit a node on the right and
|
|
|
|
|
enter on the left. (Notice the use of the key, "input_side_packet" and
|
|
|
|
|
"output_side_packet").
|
|
|
|
|
|
2022-09-06 23:29:51 +02:00
|
|
|
|
2019-08-19 04:54:50 +02:00
|
|
|
|
2022-09-06 23:29:51 +02:00
|
|
|
|
2019-06-17 01:03:25 +02:00
|
|
|
|
|
|
|
|
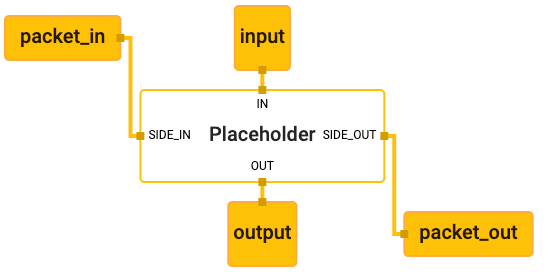
* There are special nodes that represent inputs and outputs to the graph and
|
|
|
|
|
can supply either side packets or streams.
|
|
|
|
|
|
2022-09-06 23:29:51 +02:00
|
|
|
|
2020-05-21 18:46:31 +02:00
|
|
|
|
2022-09-06 23:29:51 +02:00
|
|
|
|
2020-05-21 18:46:31 +02:00
|
|
|
|
2020-06-06 01:49:27 +02:00
|
|
|
## Visualizing Subgraphs
|
2019-08-19 04:54:50 +02:00
|
|
|
|
|
|
|
|
The MediaPipe visualizer can display multiple graphs in separate tabs. If a
|
|
|
|
|
graph has a `type` field in the top level of the graph's text proto definition,
|
|
|
|
|
and that value of graph `type` is used as a calculator name in another graph, it
|
|
|
|
|
is considered a subgraph by the visualizer and colored appropriately where it is
|
|
|
|
|
used. Clicking on a subgraph will navigate to the corresponding tab which holds
|
|
|
|
|
the subgraph's definition.
|
|
|
|
|
|
2020-06-06 01:49:27 +02:00
|
|
|
For instance, there are two graphs involved in
|
2020-06-11 06:10:39 +02:00
|
|
|
[MediaPipe Hands](../solutions/hands.md): the main graph
|
2020-05-21 18:46:31 +02:00
|
|
|
([source pbtxt file](https://github.com/google/mediapipe/blob/master/mediapipe/graphs/hand_tracking/hand_detection_mobile.pbtxt))
|
2019-08-19 04:54:50 +02:00
|
|
|
and its associated subgraph
|
2020-05-21 18:46:31 +02:00
|
|
|
([source pbtxt file](https://github.com/google/mediapipe/blob/master/mediapipe/graphs/hand_tracking/subgraphs/hand_detection_gpu.pbtxt)).
|
2019-08-19 04:54:50 +02:00
|
|
|
To visualize them:
|
2019-08-17 03:49:25 +02:00
|
|
|
|
2019-08-19 04:54:50 +02:00
|
|
|
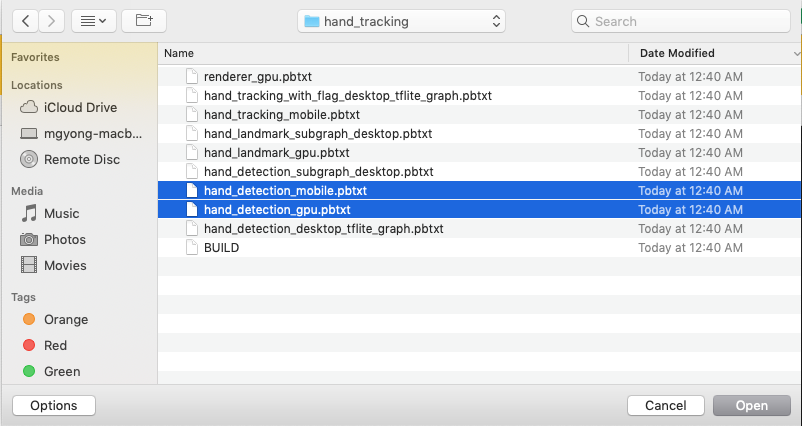
* In the MediaPipe visualizer, click on the upload graph button and select the
|
|
|
|
|
2 pbtxt files to visualize (main graph and its associated subgraph).
|
2019-08-17 03:49:25 +02:00
|
|
|
|
2022-09-06 23:29:51 +02:00
|
|
|

|
2019-08-17 03:49:25 +02:00
|
|
|
|
2022-09-06 23:29:51 +02:00
|
|
|
|
2019-08-17 03:49:25 +02:00
|
|
|
|
2019-08-19 04:54:50 +02:00
|
|
|
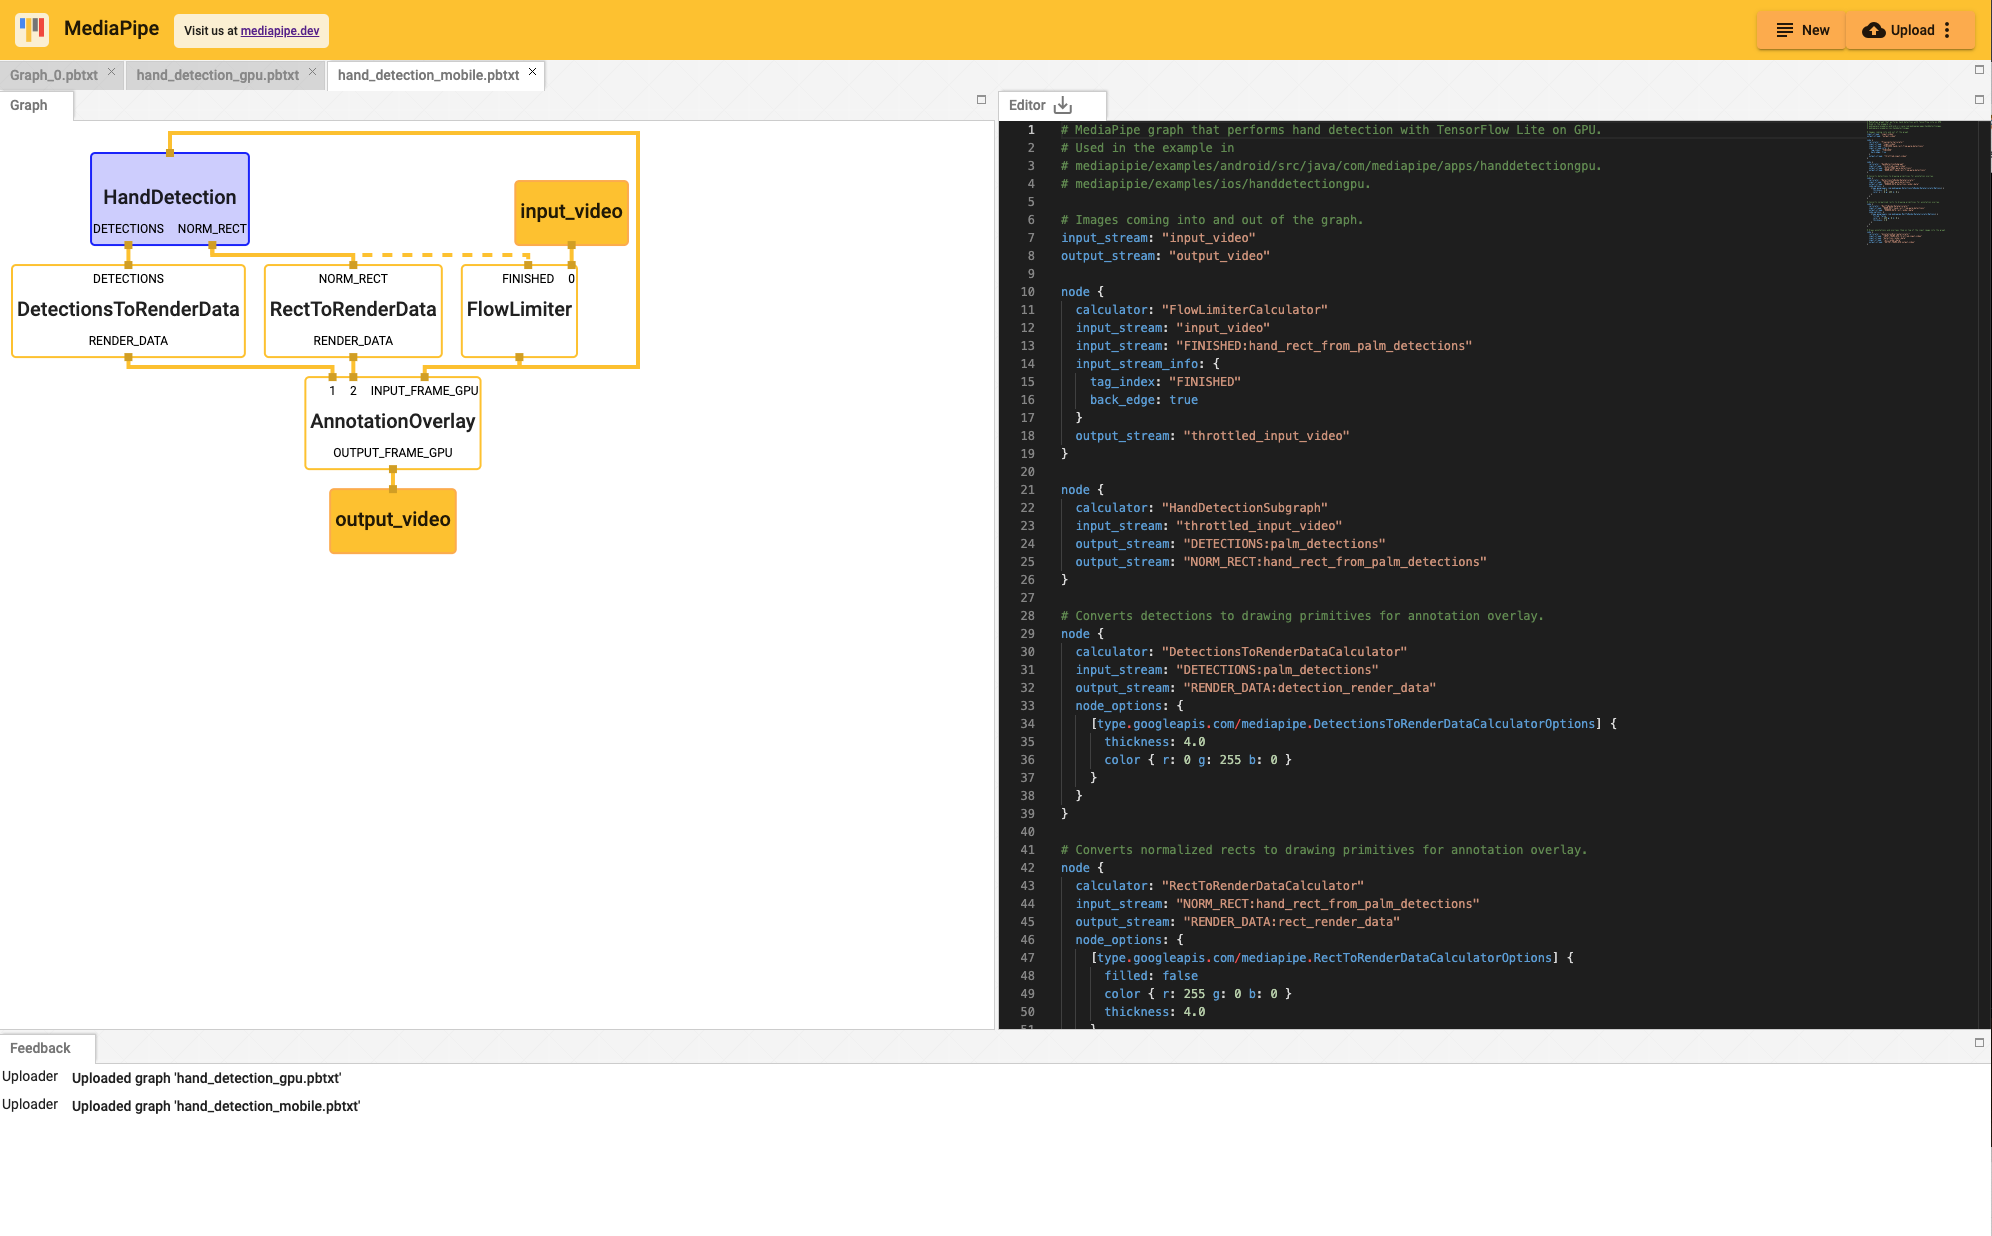
* There will be 2 additional tabs. The main graph tab is
|
|
|
|
|
`hand_detection_mobile.pbtxt`.
|
2019-08-17 03:49:25 +02:00
|
|
|
|
2022-09-06 23:29:51 +02:00
|
|
|
|
2019-08-17 03:49:25 +02:00
|
|
|
|
2019-08-19 04:54:50 +02:00
|
|
|
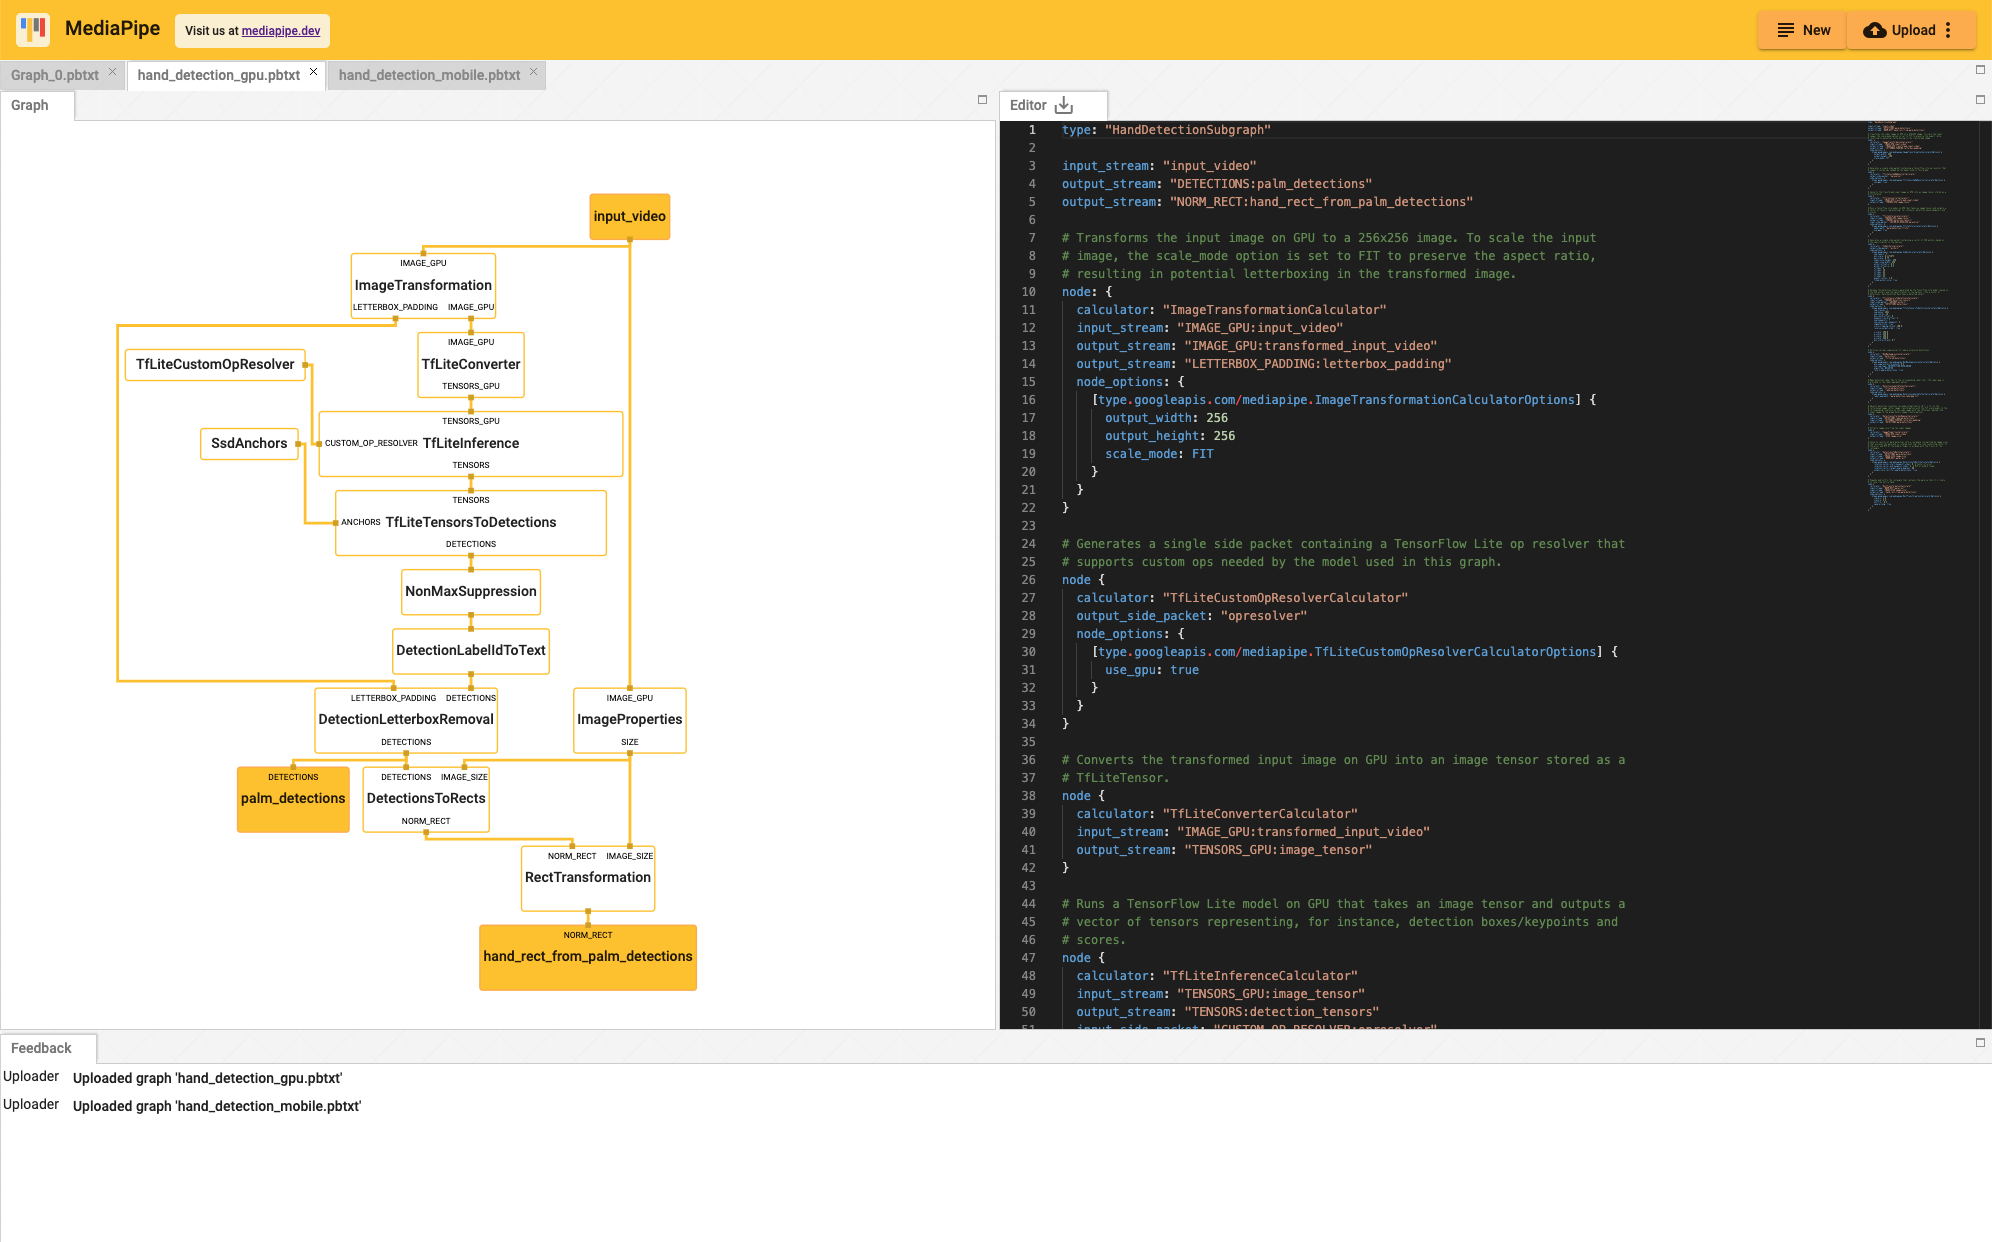
* Clicking on the `HandDetection` node in purple redirects the view to the
|
|
|
|
|
`hand_detection_gpu.pbtxt` tab.
|
2019-08-17 03:49:25 +02:00
|
|
|
|
2022-09-06 23:29:51 +02:00
|
|
|
|