2020-06-06 01:49:27 +02:00
|
|
|
---
|
|
|
|
|
layout: default
|
|
|
|
|
title: Tracing and Profiling
|
|
|
|
|
parent: Tools
|
|
|
|
|
nav_order: 2
|
|
|
|
|
---
|
|
|
|
|
|
|
|
|
|
# Tracing and Profiling
|
|
|
|
|
{: .no_toc }
|
|
|
|
|
|
|
|
|
|
1. TOC
|
|
|
|
|
{:toc}
|
|
|
|
|
---
|
|
|
|
|
|
|
|
|
|
The MediaPipe framework includes a built-in tracer and profiler. The tracer
|
|
|
|
|
records various timing events related to packet processing, including the start
|
|
|
|
|
and end time of each Calculator::Process call. The tracer writes trace log files
|
|
|
|
|
in binary protobuf format. The profiler further accumulates for each running
|
|
|
|
|
calculator a histogram of latencies for Process calls. Tracing and profiling is
|
|
|
|
|
available on Linux, Android, or iOS.
|
|
|
|
|
|
|
|
|
|
## Enabling tracing and profiling
|
|
|
|
|
|
2020-07-09 02:34:05 +02:00
|
|
|
To enable tracing and profiling of a mediapipe graph:
|
|
|
|
|
|
|
|
|
|
1. The profiling library must be linked to the framework.
|
|
|
|
|
2. Tracing and profiling must be enabled in the graph configuration.
|
|
|
|
|
|
2020-10-16 11:40:55 +02:00
|
|
|
The profiling library is linked to the framework by default for Desktop.
|
|
|
|
|
If needed, it can be omitted from the framework using the bazel command line
|
|
|
|
|
option: `--define MEDIAPIPE_PROFILING=0`. For other platforms, you can use the
|
|
|
|
|
bazel command line option `--define MEDIAPIPE_PROFILING=1` to link it.
|
2020-07-09 02:34:05 +02:00
|
|
|
|
|
|
|
|
To enable tracing and profiling, the `CalculatorGraphConfig` (in
|
2020-06-06 01:49:27 +02:00
|
|
|
[calculator.proto](https://github.com/google/mediapipe/tree/master/mediapipe/framework/calculator.proto))
|
|
|
|
|
representing the graph must have a `profiler_config` message at its root. Here
|
2020-07-30 02:33:39 +02:00
|
|
|
is a simple setup that turns on tracing and keeps 100 seconds of timing events:
|
2020-05-21 18:46:31 +02:00
|
|
|
|
|
|
|
|
```
|
|
|
|
|
profiler_config {
|
|
|
|
|
trace_enabled: true
|
2020-10-16 11:40:55 +02:00
|
|
|
enable_profiler: true
|
2020-07-30 02:33:39 +02:00
|
|
|
trace_log_interval_count: 200
|
2021-03-25 23:01:44 +01:00
|
|
|
trace_log_path: "/sdcard/Download/"
|
2020-05-21 18:46:31 +02:00
|
|
|
}
|
|
|
|
|
```
|
|
|
|
|
|
|
|
|
|
* `enable_profiler` is required to emit any logging at all.
|
|
|
|
|
|
|
|
|
|
* `trace_enabled` gives us packet level information needed for offline
|
|
|
|
|
profiling.
|
|
|
|
|
|
|
|
|
|
* `trace_log_count` is a convenience that allows us to, by default, to chop up
|
|
|
|
|
our log into five separate files which are filled up in a round robin
|
|
|
|
|
fashion (after the fifth file is recorded, the first file is used again).
|
|
|
|
|
The trace log files are named `trace_0.log` through `trace_k.log`.
|
|
|
|
|
|
2020-06-06 01:49:27 +02:00
|
|
|
See [Profiler configuration](#profiler_configuration) for other settings
|
2020-05-21 18:46:31 +02:00
|
|
|
available in the profiler config. Note that most of the other settings are
|
|
|
|
|
considered advanced, and in general should not be needed.
|
|
|
|
|
|
|
|
|
|
## Collecting the Logs
|
|
|
|
|
|
|
|
|
|
MediaPipe will emit data into a pre-specified directory:
|
|
|
|
|
|
|
|
|
|
* On the desktop, this will be the `/tmp` directory.
|
|
|
|
|
|
2021-03-25 23:01:44 +01:00
|
|
|
* On Android, this will be the external storage directory (e.g., `/storage/emulated/0/`).
|
2020-05-21 18:46:31 +02:00
|
|
|
|
|
|
|
|
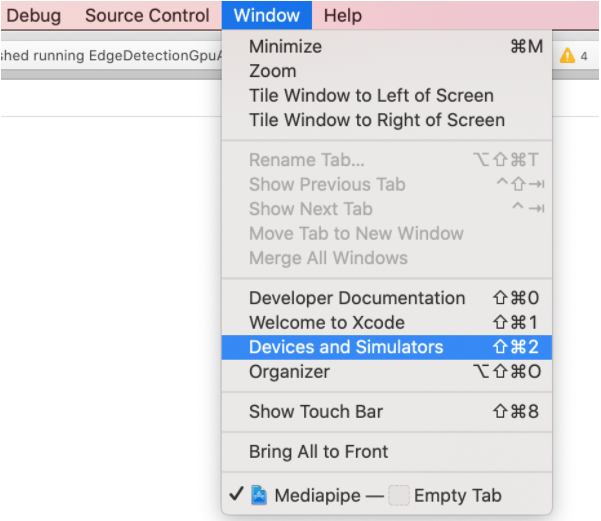
* On iOS, this can be reached through XCode. Select "Window/Devices and
|
|
|
|
|
Simulators" and select the "Devices" tab.
|
|
|
|
|
|
2022-09-06 23:29:51 +02:00
|
|
|

|
2020-05-21 18:46:31 +02:00
|
|
|
|
|
|
|
|
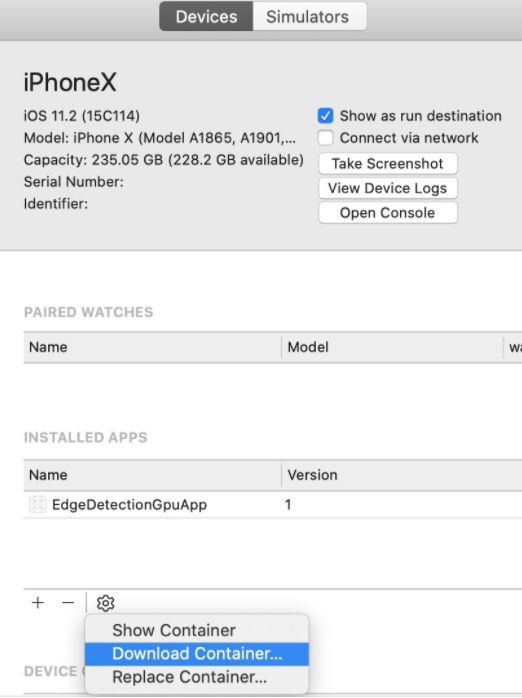
You can open the Download Container. Logs will be located in `application
|
|
|
|
|
container/.xcappdata/AppData/Documents/`
|
2020-09-16 03:31:50 +02:00
|
|
|
If XCode shows empty content for the downloaded container file, you can
|
|
|
|
|
right click and select 'Show Package Contents' in Finder. Logs
|
|
|
|
|
will be located in 'AppData/Documents/'
|
2020-05-21 18:46:31 +02:00
|
|
|
|
2022-09-06 23:29:51 +02:00
|
|
|

|
2020-05-21 18:46:31 +02:00
|
|
|
|
|
|
|
|
Log files are written to `\<trace_log_path index\>.binarypb` where, by default,
|
|
|
|
|
`\<trace_log_path\>` is equal to `mediapipe_trace_` (the entire path and file
|
|
|
|
|
prefix can be overwritten by setting `trace_log_path` within the
|
|
|
|
|
`profiler_config` message). The index will, by default, alternate between 0 and
|
|
|
|
|
1, unless you've overridden the trace_log_count as we did, above.
|
|
|
|
|
|
|
|
|
|
By default, each file records five seconds of events. (Advanced: Specifically,
|
|
|
|
|
we record ten intervals of half a second each. This can be overridden by adding
|
|
|
|
|
`trace_log_interval_usec` and `trace_log_interval_count` to `profiler_config`).
|
|
|
|
|
|
|
|
|
|
### Tracing on Linux
|
|
|
|
|
|
|
|
|
|
1. Follow the instructions stated above in `Enable tracing`
|
|
|
|
|
|
|
|
|
|
2. Build and run your MediaPipe graph. The running graph writes trace events as
|
|
|
|
|
stated above in `Collect the logs`
|
|
|
|
|
|
|
|
|
|
### Tracing on Android
|
|
|
|
|
|
|
|
|
|
* Ensure that the Android app has write permissions to external storage.
|
|
|
|
|
|
|
|
|
|
* Include the line below in your `AndroidManifest.xml` file.
|
|
|
|
|
|
|
|
|
|
```xml
|
2021-03-25 23:01:44 +01:00
|
|
|
<uses-permission android:name="android.permission.MANAGE_EXTERNAL_STORAGE" />
|
2020-05-21 18:46:31 +02:00
|
|
|
```
|
|
|
|
|
|
|
|
|
|
* Grant the permission either upon first app launch, or by going into
|
|
|
|
|
`Settings -> Apps & notifications -> $YOUR_APP -> Permissions` and
|
|
|
|
|
enable `Storage`.
|
|
|
|
|
|
|
|
|
|
* Add the following protobuf message into the existing calculator-graph-config
|
|
|
|
|
protobuf, such as the existing `.pbtxt` file. Follow the instructions stated
|
|
|
|
|
above in `Enable tracing`
|
|
|
|
|
|
|
|
|
|
* Connect your Android device and run `adb devices`.
|
|
|
|
|
|
|
|
|
|
```bash
|
|
|
|
|
adb devices
|
|
|
|
|
# should print:
|
|
|
|
|
# List of devices attached
|
|
|
|
|
# 805KPWQ1876505 device
|
|
|
|
|
```
|
|
|
|
|
|
|
|
|
|
* Use `bazel build` to compile the Android app and use `adb install` to get it
|
|
|
|
|
installed on your Android device.
|
|
|
|
|
|
|
|
|
|
* Open the installed Android app. The running MediaPipe graph appends trace
|
|
|
|
|
events to a trace log files at:
|
|
|
|
|
|
|
|
|
|
```bash
|
2021-03-25 23:01:44 +01:00
|
|
|
/storage/emulated/0/Download/mediapipe_trace_0.binarypb
|
|
|
|
|
/storage/emulated/0/Download/mediapipe_trace_1.binarypb
|
2020-05-21 18:46:31 +02:00
|
|
|
```
|
|
|
|
|
|
|
|
|
|
After every 5 sec, writing shifts to a successive trace log file, such that
|
|
|
|
|
the most recent 5 sec of events are preserved. You can check whether the
|
|
|
|
|
trace files have been written to the device using adb shell.
|
|
|
|
|
|
|
|
|
|
```bash
|
2021-03-25 23:01:44 +01:00
|
|
|
adb shell "ls -la /storage/emulated/0/Download"
|
2020-05-21 18:46:31 +02:00
|
|
|
```
|
|
|
|
|
|
2021-03-25 23:01:44 +01:00
|
|
|
On android, MediaPipe selects the external storage (e.g., `/storage/emulated/0/`) for
|
2020-05-21 18:46:31 +02:00
|
|
|
trace logs. This directory can be overridden using the setting
|
|
|
|
|
`trace_log_path`, like:
|
|
|
|
|
|
|
|
|
|
```bash
|
|
|
|
|
profiler_config {
|
|
|
|
|
trace_enabled: true
|
2020-10-16 11:40:55 +02:00
|
|
|
enable_profiler: true
|
2021-03-25 23:01:44 +01:00
|
|
|
trace_log_path: "/sdcard/Download/profiles/"
|
2020-05-21 18:46:31 +02:00
|
|
|
}
|
|
|
|
|
```
|
|
|
|
|
|
2020-08-30 05:41:10 +02:00
|
|
|
Note: The forward slash at the end of the `trace_log_path` is necessary for
|
|
|
|
|
indicating that `profiles` is a directory (that *should* exist).
|
|
|
|
|
|
2020-05-21 18:46:31 +02:00
|
|
|
* Download the trace files from the device.
|
|
|
|
|
|
|
|
|
|
```bash
|
|
|
|
|
# from your terminal
|
2021-03-25 23:01:44 +01:00
|
|
|
adb pull /storage/emulated/0/Download/mediapipe_trace_0.binarypb
|
2020-05-21 18:46:31 +02:00
|
|
|
# if successful you should see something like
|
|
|
|
|
# /sdcard/mediapipe_trace_0.binarypb: 1 file pulled. 0.1 MB/s (6766 bytes in 0.045s)
|
|
|
|
|
```
|
|
|
|
|
|
|
|
|
|
## Analyzing the Logs
|
|
|
|
|
|
|
|
|
|
Trace logs can be analyzed from within the visualizer.
|
|
|
|
|
|
|
|
|
|
1. Navigate to
|
|
|
|
|
[viz.mediapipe.dev](https://viz.mediapipe.dev)
|
|
|
|
|
|
|
|
|
|
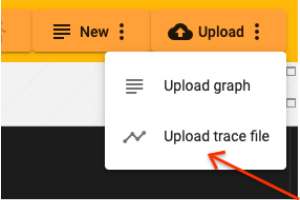
2. Click on the "Upload" button in the upper right.
|
|
|
|
|
|
2022-09-06 23:29:51 +02:00
|
|
|

|
2020-05-21 18:46:31 +02:00
|
|
|
|
|
|
|
|
3. Click on "Upload trace file".
|
|
|
|
|
|
2022-09-06 23:29:51 +02:00
|
|
|

|
2020-05-21 18:46:31 +02:00
|
|
|
|
|
|
|
|
A sample trace file has been generated for you:
|
2020-06-06 01:49:27 +02:00
|
|
|
[sample_trace_binary.pb](../data/visualizer/sample_trace.binarypb)
|
2020-05-21 18:46:31 +02:00
|
|
|
|
|
|
|
|
4. A file selection popup will appear. Select the `.binarypb` that holds your
|
|
|
|
|
trace information.
|
|
|
|
|
|
|
|
|
|
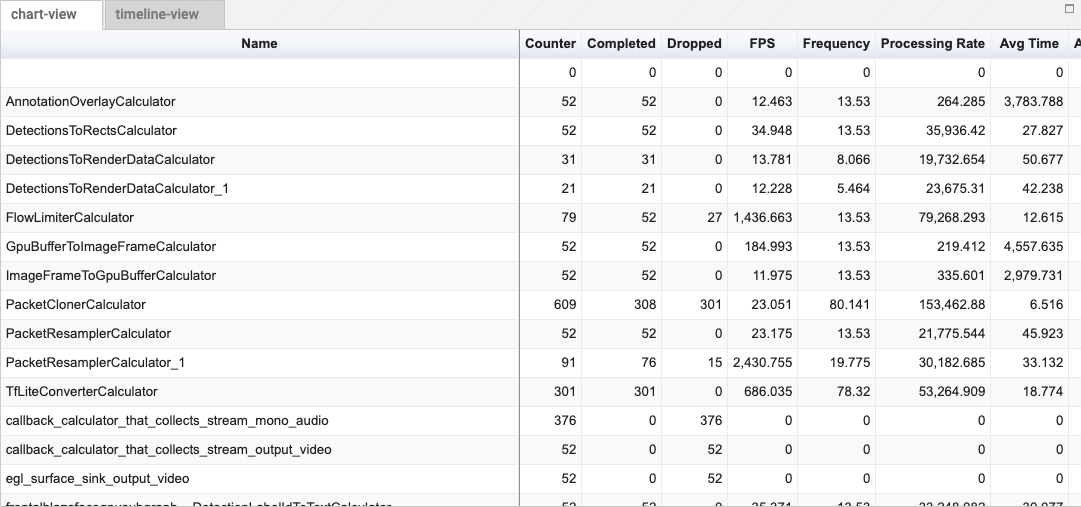
5. A chart view will appear. All of your calculators will appear along the left
|
|
|
|
|
with profiling information listed along the top.
|
|
|
|
|
|
2022-09-06 23:29:51 +02:00
|
|
|

|
2020-05-21 18:46:31 +02:00
|
|
|
|
|
|
|
|
Click on a header to alternately sort that column in ascending or descending
|
|
|
|
|
order. You can also scroll horizontally and vertically within the control to
|
|
|
|
|
see more columns and more calculators.
|
|
|
|
|
|
|
|
|
|
### Explanation of columns:
|
|
|
|
|
|
|
|
|
|
name
|
|
|
|
|
: The name of the calculator.
|
|
|
|
|
|
|
|
|
|
fps
|
|
|
|
|
: The number of frames that this calculator can generate each second, on
|
|
|
|
|
average. `1 / (input_latency_mean + time_mean`) (Units are 1 / second).
|
|
|
|
|
|
|
|
|
|
frequency
|
|
|
|
|
: The rate that this calculator was asked to process packets per second.
|
|
|
|
|
(Computed by `# of calls total / (last_call_time - first_call_time))`.
|
|
|
|
|
(Units are `1 / second`)
|
|
|
|
|
|
|
|
|
|
counter
|
|
|
|
|
: Number of times process() was called on the calculator. It is the `sum of
|
|
|
|
|
dropped + completed`.
|
|
|
|
|
|
|
|
|
|
dropped
|
|
|
|
|
: Number of times the calculator was called but did not produce an output.
|
|
|
|
|
|
|
|
|
|
completed
|
|
|
|
|
: Number of times that this calculator was asked to process inputs after which
|
|
|
|
|
it generated outputs.
|
|
|
|
|
|
|
|
|
|
processing_rate
|
|
|
|
|
: `1E+6 / time_mean`. The number of times per second this calculator could run
|
|
|
|
|
process, on average. (Units are `1 / second`).
|
|
|
|
|
|
|
|
|
|
thread_count
|
|
|
|
|
: The number of threads that made use of each calculator.
|
|
|
|
|
|
|
|
|
|
time_mean
|
|
|
|
|
: Average time spent within a calculator (in microseconds).
|
|
|
|
|
|
|
|
|
|
time_stddev
|
|
|
|
|
: Standard deviation of time_mean (in microseconds).
|
|
|
|
|
|
|
|
|
|
time_total
|
|
|
|
|
: Total time spent within a calculator (in microseconds).
|
|
|
|
|
|
|
|
|
|
time_percent
|
|
|
|
|
: Percent of total time spent within a calculator.
|
|
|
|
|
|
|
|
|
|
input_latency_mean
|
|
|
|
|
: Average latency between earliest input packet used by a iteration of the
|
|
|
|
|
calculator and when the calculator actually begins processing (in
|
|
|
|
|
microseconds).
|
|
|
|
|
|
|
|
|
|
input_latency_stddev
|
|
|
|
|
: Standard deviation of input_latency_mean (in microseconds).
|
|
|
|
|
|
|
|
|
|
input_latency_total
|
|
|
|
|
: Total accumulated input_latency (in microseconds).
|
2020-06-06 01:49:27 +02:00
|
|
|
|
|
|
|
|
## Profiler configuration
|
|
|
|
|
|
|
|
|
|
Many of the following settings are advanced and not recommended for general
|
|
|
|
|
usage. Consult [Enabling tracing and profiling](#enabling-tracing-and-profiling)
|
|
|
|
|
for a friendlier introduction.
|
|
|
|
|
|
2022-05-04 00:29:57 +02:00
|
|
|
histogram_interval_size_usec
|
|
|
|
|
: Specifies the size of the runtimes histogram intervals (in microseconds) to
|
|
|
|
|
generate the histogram of the `Process()` time. The last interval extends to
|
|
|
|
|
+inf. If not specified, the interval is 1000000 usec = 1 sec.
|
2020-06-06 01:49:27 +02:00
|
|
|
|
2022-05-04 00:29:57 +02:00
|
|
|
num_histogram_intervals
|
|
|
|
|
: Specifies the number of intervals to generate the histogram of the
|
|
|
|
|
`Process()` runtime. If not specified, one interval is used.
|
2020-06-06 01:49:27 +02:00
|
|
|
|
|
|
|
|
enable_profiler
|
|
|
|
|
: If true, the profiler starts profiling when graph is initialized.
|
|
|
|
|
|
|
|
|
|
enable_stream_latency
|
|
|
|
|
: If true, the profiler also profiles the stream latency and input-output
|
|
|
|
|
latency. No-op if enable_profiler is false.
|
|
|
|
|
|
|
|
|
|
use_packet_timestamp_for_added_packet
|
|
|
|
|
: If true, the profiler uses packet timestamp (as production time and source
|
|
|
|
|
production time) for packets added by calling
|
|
|
|
|
`CalculatorGraph::AddPacketToInputStream()`. If false, uses the profiler's
|
|
|
|
|
clock.
|
|
|
|
|
|
|
|
|
|
trace_log_capacity
|
|
|
|
|
: The maximum number of trace events buffered in memory. The default value
|
|
|
|
|
buffers up to 20000 events.
|
|
|
|
|
|
|
|
|
|
trace_event_types_disabled
|
|
|
|
|
: Trace event types that are not logged.
|
|
|
|
|
|
|
|
|
|
trace_log_path
|
|
|
|
|
: The output directory and base-name prefix for trace log files. Log files are
|
2022-05-04 00:29:57 +02:00
|
|
|
written to: `StrCat(trace_log_path, index, ".binarypb")`
|
2020-06-06 01:49:27 +02:00
|
|
|
|
|
|
|
|
trace_log_count
|
|
|
|
|
: The number of trace log files retained. The trace log files are named
|
|
|
|
|
"`trace_0.log`" through "`trace_k.log`". The default value specifies 2
|
|
|
|
|
output files retained.
|
|
|
|
|
|
|
|
|
|
trace_log_interval_usec
|
|
|
|
|
: The interval in microseconds between trace log output. The default value
|
|
|
|
|
specifies trace log output once every 0.5 sec.
|
|
|
|
|
|
|
|
|
|
trace_log_margin_usec
|
|
|
|
|
: The interval in microseconds between TimeNow and the highest times included
|
|
|
|
|
in trace log output. This margin allows time for events to be appended to
|
|
|
|
|
the TraceBuffer.
|
|
|
|
|
|
2020-08-13 03:57:56 +02:00
|
|
|
trace_log_instant_events
|
2020-06-06 01:49:27 +02:00
|
|
|
: False specifies an event for each calculator invocation. True specifies a
|
|
|
|
|
separate event for each start and finish time.
|
|
|
|
|
|
|
|
|
|
trace_log_interval_count
|
|
|
|
|
: The number of trace log intervals per file. The total log duration is:
|
2022-05-04 00:29:57 +02:00
|
|
|
`trace_log_interval_usec * trace_log_count * trace_log_interval_count`. The
|
|
|
|
|
default value specifies 10 intervals per file.
|
2020-06-06 01:49:27 +02:00
|
|
|
|
|
|
|
|
trace_log_disabled
|
|
|
|
|
: An option to turn ON/OFF writing trace files to disk. Saving trace files to
|
|
|
|
|
disk is enabled by default.
|
|
|
|
|
|
|
|
|
|
trace_enabled
|
|
|
|
|
: If true, tracer timing events are recorded and reported.
|